Checking the Index Rollover
If the Elasticsearch index is getting too big, the most likely reason is that it is not rolled over correctly.
Indicator
If one of the SEAL indices in the Elasticsearch database is not rolled over correctly, you may recognize this by missing indices ending with 000nnn.
This may occur, in older installations which have been configured by hand, instead of using the load-config configuration script of SEAL Elastic Stack.
Even if only few data are stored in the affected index, we recommend you correct this situation. Otherwise the index lifecycle policy is not able to work properly and delete deprecated data. In this case the index will become too big and require more disk space than desired.
Solution: Reindexing the Data and Selecting a Time Frame
In the easiest case you can do without the data in the affected index. It is not sufficient though, to just delete the index via the Kibana User Interface.
When log messages are stored in the Elasticsearch database, an alias is used for each index, so the name of the current writing index does not need to be known outside the database. Such an alias can only be used, if no index of the same name exists. Therefore the basic proceeding is as follows:
-
Stop data entries to this index.
-
Create a new index ending with
000001. -
Copy the existing data to this new index.
Hint - backup
You can skip this step, if you can do without these data. For example, you can make a backup before, see Complete Backup under Windows or Complete Backup under Linux.
Hint - Elasticsearch query
If you copy the data, you can use an Elasticserch query to selectively copy only specific data.
-
Delete the old index.
-
Create an alias.
-
Reopen the data entries.
You can correct the situation by either
Executig the load-config Configuration Script in the Overwrite Mode
In the overwrite mode, the configuration script automatically tries to repair an index that is not rolled. But, this only works, if the index does not contain so many data. Otherwise the script reaches a timeout and eliminates any traces from the attempt to repair.
-
Stop all data entries to this index.
You can do this by one of the following actions:
-
Stop all Filebeat processes that write into the affected index.
Usually this inludes 3 Filebeat processes from your PLOSSYS-5-Cluster and maybe one on the management server.
-
If you use a firewall, deactivate the corresponding rule concerning the access to the Elasticsearch database.
Usually this is port 9200.
-
If you have activated the security in your SEAL Elastic Stack installation, you can temporarily change the password fo the user that is used by the Filebeat processes and restore the previous password after the successful repair.
-
If none of the above is possible, you have to reconfigure the Filebeat installations so that they write their log data into a completely new index. Then you can repair the affected index and afterwards restore the previous configuration. Finally, you have to copy the data that have been logged into the temporary index in the meantime into the target index by hand. Then you can delete the temporary index. However, these actions are rather complex so that we strongly recommend you do this only in accordance with the SEAL Systems support.
-
-
Executing the script
-
under Windows, see Configuration via Script:
Set-ExecutionPolicy Bypass -Scope Process -Force; "C:\Program Files\SEAL Systems\seal-kibana\configuration\load-config.ps1" -o -
under Linux, see Configuration via Script:
/opt/seal/seal-kibana/configuration/load-config.sh -o
-
Manual Correction
In the following examples the seal-plossys-5-log index is used, because in most cases this is the affected index.
-
Stop Filebeat on all PLOSSYS servers and the management server.
This way current messages cannot get lost and the repair will work better.
-
In the DevTools Console, create a new index:
PUT /seal-plossys-5-log-000001The result should look like this:
{ "acknowledged" : true, "shards_acknowledged" : true, "index" : "seal-plossys-5-log-000001" } -
If you wish to preserve specific data, start a search in the
DiscoverApp of the Kibana user interface and copy the results.You can determine the query that has been used for the search in the
DiscoverApp underInspect->Request: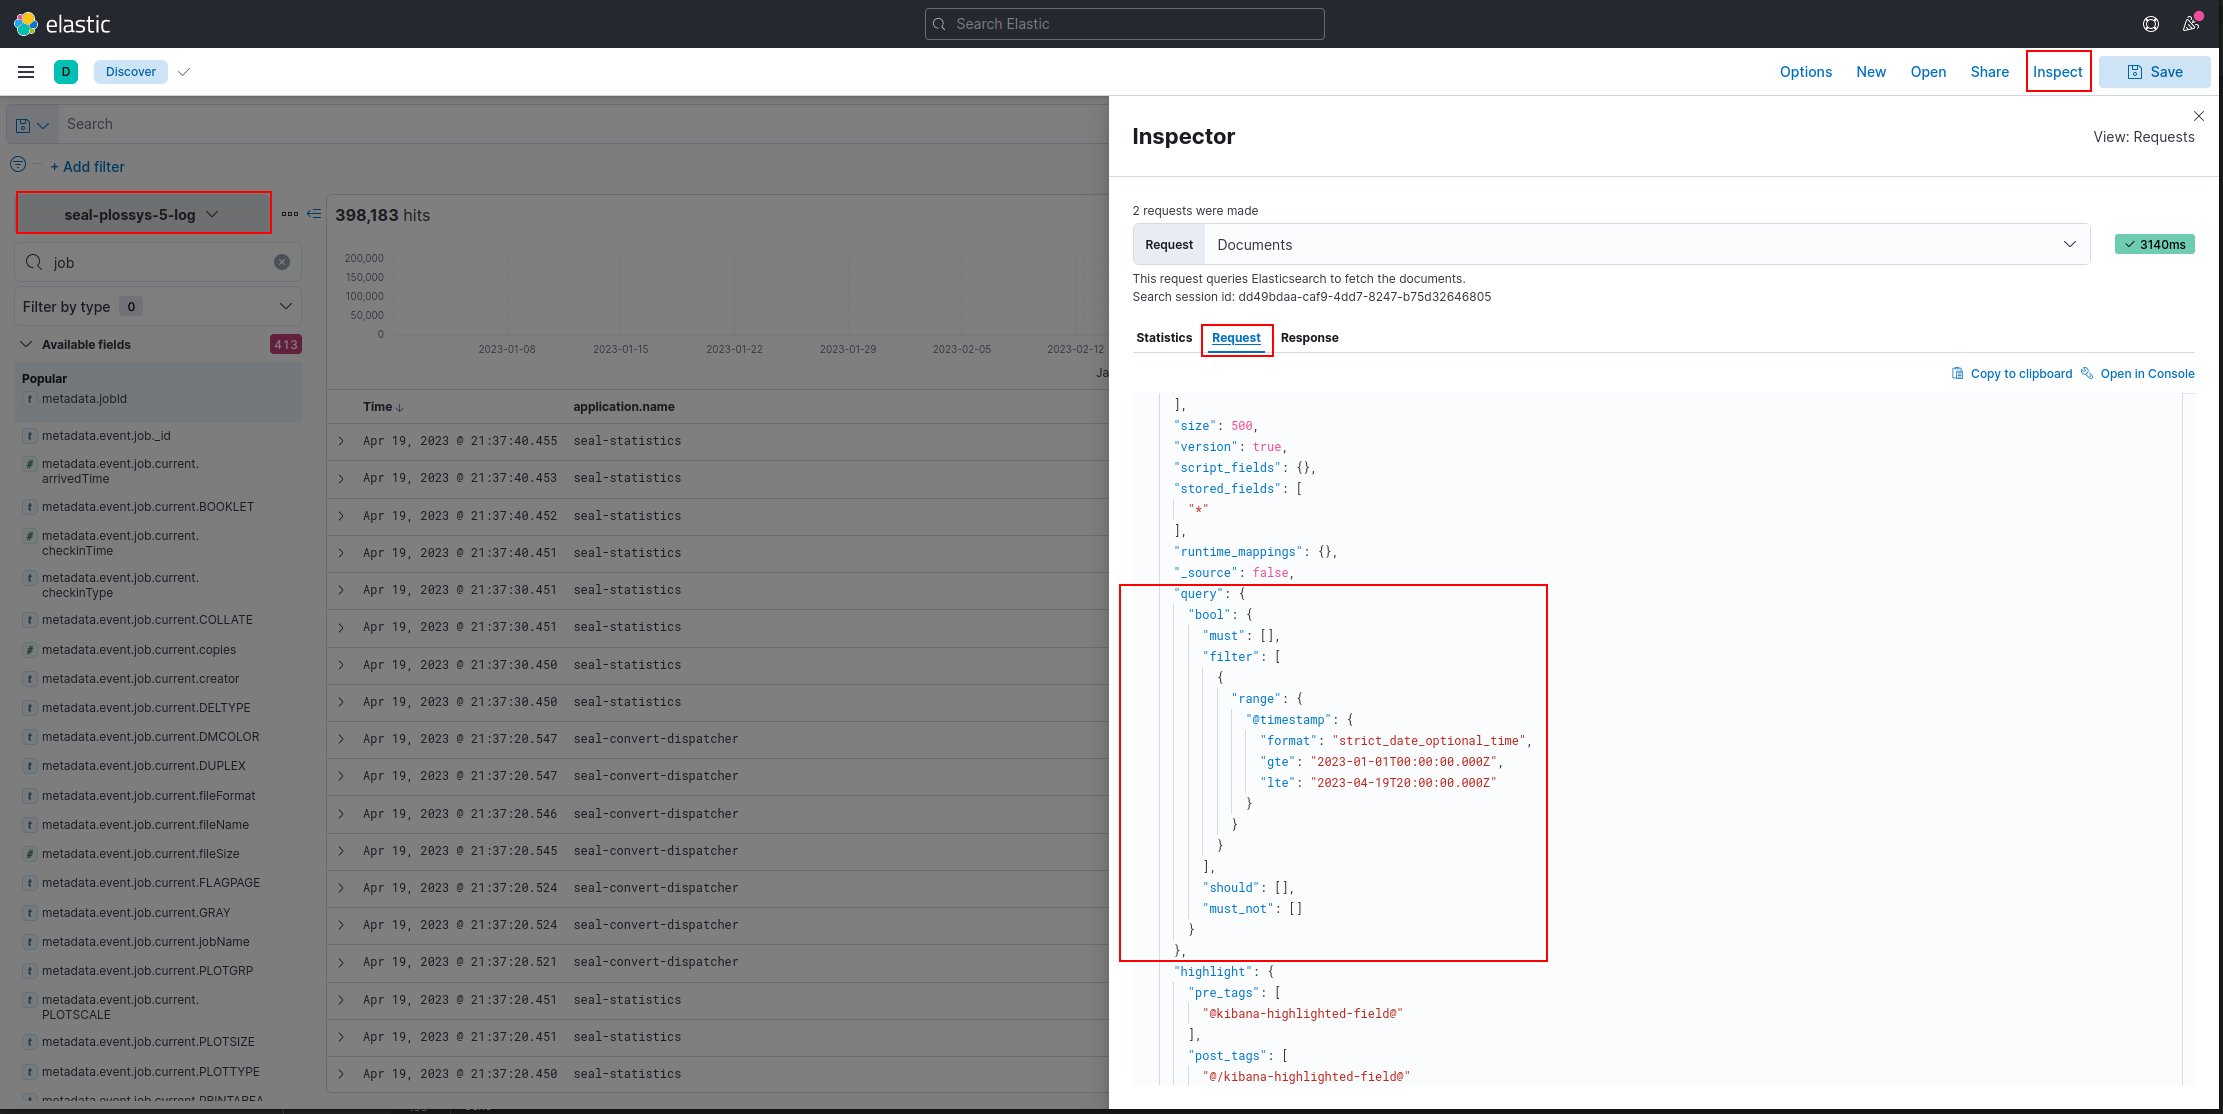
-
Test the determined query in the DevTools Console for correctness and to get the number of hits.
Here the time slot from 2023-01-01 to 2023-04-19 has been used:
GET /seal-plossys-5-log/_search?scroll=1m&filter_path=hits.total
{
  "query": {
    "bool": {
      "filter": [
        {
          "range": {
            "@timestamp": {
              "format": "strict_date_optional_time",
              "gte": "2023-01-01T00:00:00.000Z",
              "lte": "2023-04-19T20:00:00.000Z"
            }
          }
        }
      ]
    }
  }
}
The result should look like this:
{
  "hits" : {
    "total" : {
      "value" : 360360,
      "relation" : "eq"
    }
  }
}
Caution - UTC
Search queries use UTC, e. g. Zulu time, recognizable by the
Zat the end. The browser time may differ.These queries are not essential, but they show whether you have transferred the query correctly. The number of hits here should be the same as in the
DiscoverApp.Caution - Filebeat still stopped
Make sure that all your Filebeat installations are still stopped. Otherwise new data may be stored in the index you are about to repair.
-
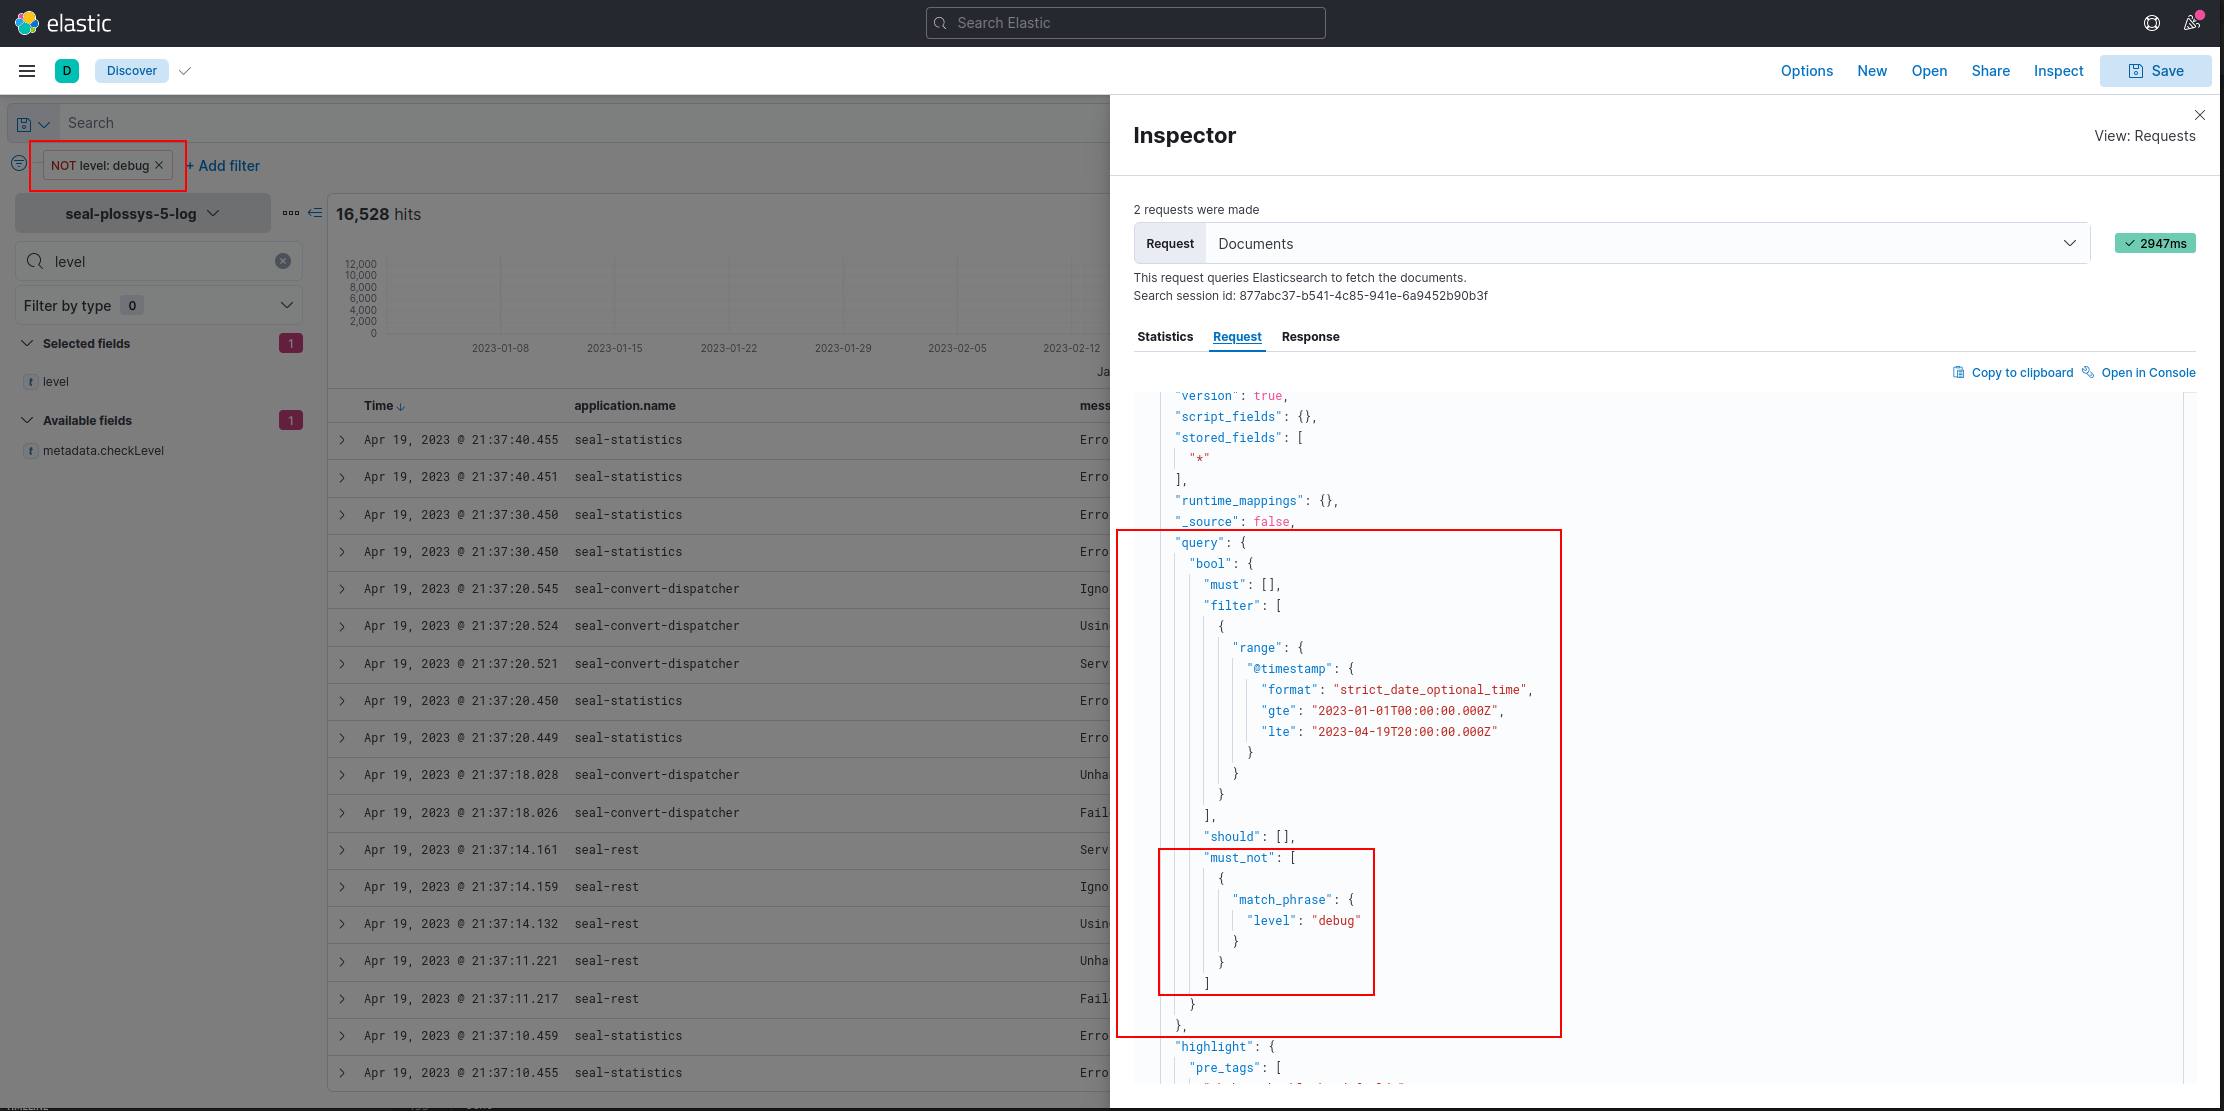
Additionally, you can test, whether the debug mode has been defined and filter corresponding entries:
-
Copy the data from the specified time slot into the newly created index.
Because of the amount of data, we have created a task. This task is started and runs in the background until the copying is finished:
Adjust the starting and finishing date of your time slot.
POST _reindex?wait_for_completion=false
{
  "source": {
    "index": "seal-plossys-5-log",
    "query": {
      "bool": {
        "filter": [
          {
            "range": {
              "@timestamp": {
                "format": "strict_date_optional_time",
                "gte": "2023-01-01T00:00:00.000Z",
                "lte": "2023-04-19T20:00:00.000Z"
              }
            }
          }
        ]
      }
    }
  },
  "dest": {
  "index": "seal-plossys-5-log-000001"
  }
}
As a result you will receive a task ID:
{ "task" : "iOF33wdST8evcUnNAJEskw:129260" } -
You can follow the progress of the task
-
in the index management in the Kibana user interface by refreshing the view or
-
in the DevTools Console by entering the task ID in the task API:
GET /_tasks/iOF33wdST8evcUnNAJEskw:129260
As long as the task is busy, you will receive replies like the following:
{
  "completed" : false,
  "task" : {
    "node" : "iOF33wdST8evcUnNAJEskw",
    "id" : 129260,
    "type" : "transport",
    "action" : "indices:data/write/reindex",
    "status" : {
      "total" : 360360,
      "updated" : 88000,
      "created" : 0,
      "deleted" : 0,
      "batches" : 89,
      "version_conflicts" : 0,
      "noops" : 0,
      "retries" : {
        "bulk" : 0,
        "search" : 0
      },
      "throttled_millis" : 0,
      "requests_per_second" : -1.0,
      "throttled_until_millis" : 0
    },
    "description" : "reindex from [seal-plossys-5-log] to [seal-plossys-5-log-000001][_doc]",
    "start_time_in_millis" : 1681915060962,
    "running_time_in_nanos" : 20934043870,
    "cancellable" : true,
    "cancelled" : false,
    "headers" : { }
  }
}
As soon as the task is finished, with the next request you will receive a reply starting like this:
{ "completed" : true, "task" : { "node" : "iOF33wdST8evcUnNAJEskw", "id" : 129260, "type" : "transport", "action" : "indices:data/write/reindex", "status" : { "total" : 360360, "updated" : 360360, "created" : 0, "deleted" : 0, "batches" : 361, "version_conflicts" : 0, "noops" : 0, "retries" : { "bulk" : 0, "search" : 0 }, "throttled_millis" : 0, "requests_per_second" : -1.0, "throttled_until_millis" : 0 }, "description" : "reindex from [seal-plossys-5-log] to [seal-plossys-5-log-000001][_doc]", "start_time_in_millis" : 1681913749578, "running_time_in_nanos" : 105396533245, "cancellable" : true, "cancelled" : false, "headers" : { } }, ... } -
-
In the
DiscoverApp, check the new index, whether the data have been transferred correctly. -
Back up the data that are to be deleted, e. g. by making a snapshot.
You can store the snapshot on the hard disk, if you have enough disk space available, or select one of the possibilities Elasticsearch offers.
-
Delete the index that has become too big:
DELETE /seal-plossys-5-log -
In the index management or in the API, refresh the indices:
GET _refresh -
Check the existing aliases. You can list the currently configured aliases as follows:
GET /_cat/aliasesThe result should look like this:
seal-plossys-5-accounting seal-plossys-5-accounting-000008 ---true seal-plossys-5-accounting seal-plossys-5-accounting-000007 ---false seal-plossys-5-accounting seal-plossys-5-accounting-000006 ---false seal-plossys-5-audit seal-plossys-5-audit-000008 ---true seal-plossys-5-audit seal-plossys-5-audit-000007 ---false seal-plossys-5-statistics seal-plossys-5-statistics-000007 ---false seal-plossys-5-statistics seal-plossys-5-statistics-000008 ---truetrueandfalseindicate the corresponding write index. This should be the index with the highest number in a series.As you can see, there is no
seal-plossys-5-logalias. You have to create it manually. -
Create the
seal-plossys-5-logalias. At the same time this new index ist marked as write index:POST _aliases { "actions": [ { "add": { "index": "seal-plossys-5-log-000001", "alias": "seal-plossys-5-log", "is_write_index": true } } ] } -
Check the list of aliases again:
GET /_cat/aliasesNow, the result should look like this:
seal-plossys-5-accounting seal-plossys-5-accounting-000008 ---true seal-plossys-5-accounting seal-plossys-5-accounting-000007 ---false seal-plossys-5-accounting seal-plossys-5-accounting-000006 ---false seal-plossys-5-audit seal-plossys-5-audit-000008 ---true seal-plossys-5-audit seal-plossys-5-audit-000007 ---false seal-plossys-5-statistics seal-plossys-5-statistics-000007 ---false seal-plossys-5-statistics seal-plossys-5-statistics-000008 ---true seal-plossys-5-log seal-plossys-5-log-000001 ---true -
Verify, whether the lifecycle mechanism works and perform a rollover:
POST /seal-plossys-5-log/_rolloverYour new index with the copied data will be changed into a read-only index and a new
seal-plossys-5-log-000002write index is created. The read-only index responds to the settings of the lifecycle policy.By default, the read-only index will be deleted in case of audit and accounting indices after 365 days, and in case of log and statistics indices after 7 days. However, in older configurations the deletion time may for all indices be set to 7 days.
The result should look like this:
{ "acknowledged" : true, "shards_acknowledged" : true, "old_index" : "seal-plossys-5-log-000001", "new_index" : "seal-plossys-5-log-000002", "rolled_over" : true, "dry_run" : false, "conditions" : { } } -
Check the list of aliases once more:
GET /_cat/aliasesseal-plossys-5-accounting seal-plossys-5-accounting-000008 ---true seal-plossys-5-accounting seal-plossys-5-accounting-000007 ---false seal-plossys-5-accounting seal-plossys-5-accounting-000006 ---false seal-plossys-5-audit seal-plossys-5-audit-000008 ---true seal-plossys-5-audit seal-plossys-5-audit-000007 ---false seal-plossys-5-statistics seal-plossys-5-statistics-000007 ---false seal-plossys-5-statistics seal-plossys-5-statistics-000008 ---true seal-plossys-5-log seal-plossys-5-log-000001 ---false seal-plossys-5-log seal-plossys-5-log-000002 ---trueNow there are two
seal-plossys-5-logindices:seal-plossys-5-log-000001is a read-only index.seal-plossys-5-log-000002is the new write index.
-
Repair further indices, if necessary.
-
Restart Filebeat:
-
Linux:
sudo systemctl start seal-filebeat -
Windows:
start-service seal-filebeat
-